Think your apartment is bad? A look at one month of NYC building violations
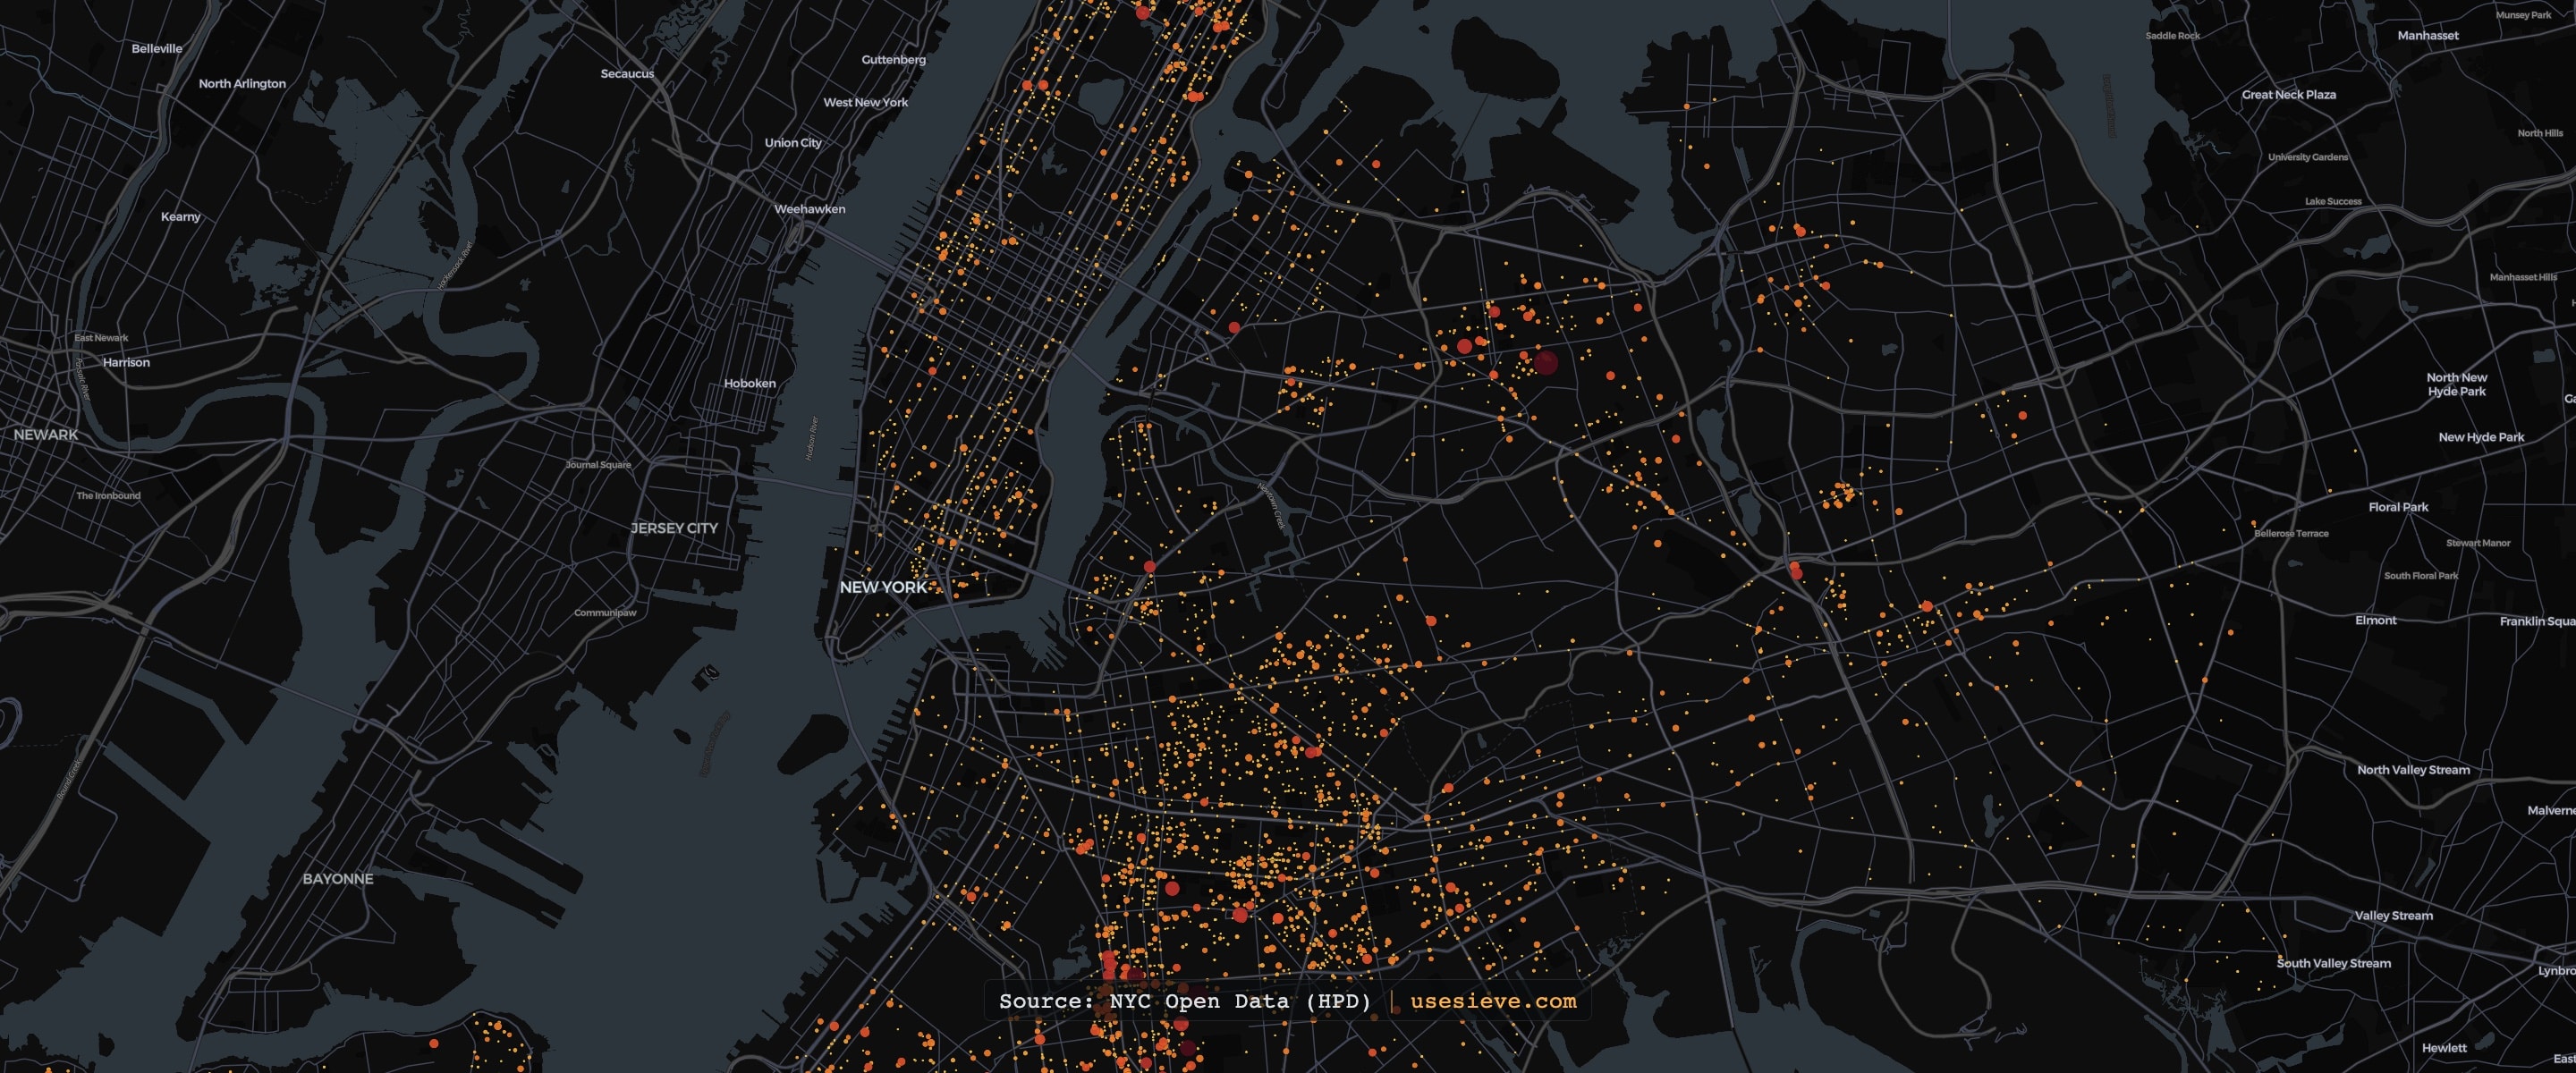
More than 60% of moves in NYC happen in the summer, which means a lot of people are currently asking themselves "Is this apartment a great deal, or did it inspire Dante's Inferno?" Or, more pragmatically, "I know it is definitely one of the circles of hell - but which one is it? Is the third circle better on a relative-value basis than the first? Will I save on heat in the winter?"
I built an interactive map so you can check whether your building - or your friend's building, or the building you are about to irrationally overpay for - is on the list.
Open the interactive NYC building violations map →
A few findings
- Half of all violations came from just 16% of buildings. (Don't move there.)
- More than a quarter came from the worst 5% of buildings. (Definitely don't move there.)
- One building that looks too good bad to be true. Our agent flagged what looked like a parsing error: 100 violations tied to a single unit. Upon checking, it was not a parsing error. It was one apartment that has really just seen much better times.
The good news
Most buildings are fine. The vast majority of buildings in NYC have no violations at all. Among buildings that do show up in the data, about one in five have only a single violation. The median flagged building has 4. The worst has 222.
So, statistically, your building is probably fine. But when signing a lease, paying a broker fee, and agreeing to spend the next year hoping the spots on the ceiling are just stains, you probably want to feel more confident than "probably fine".
One more thought: if I was in the home services business, I'd be tracking this list like a hawk - it seems like a list of "buildings that really, really need maintenance." Contact us if you'd like to learn more about that.
This map was assembled by sieve agents parsing messy public records (in this case, NYC Open Data (HPD)) into clean, verified data. If your team needs to turn scattered, unstructured sources into a dataset you can trust, reach us at hello@usesieve.com.